Cause-Effect Project Charts - Fishbone Diagram

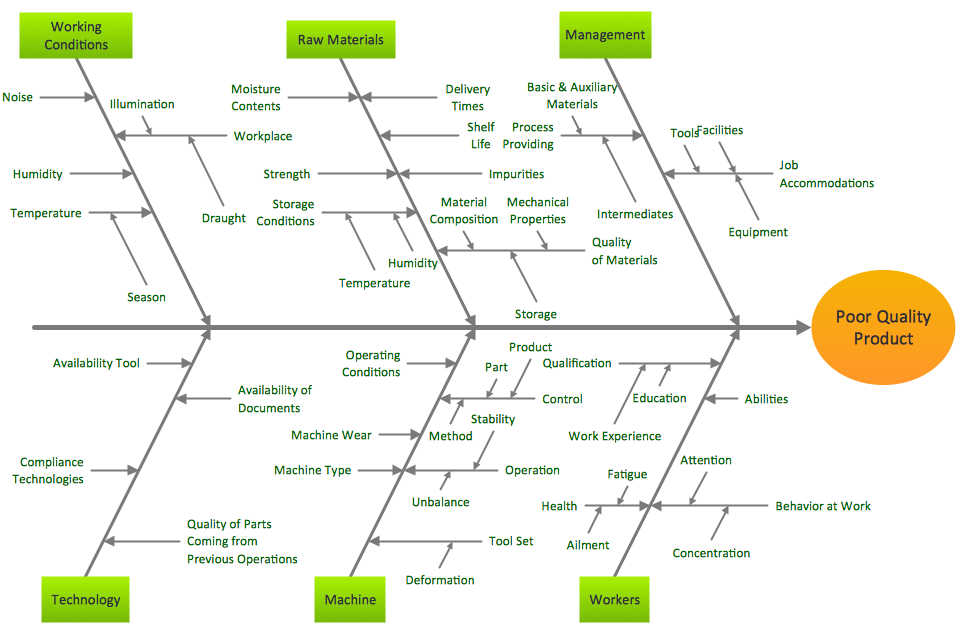
What is a Cause-Effect Project Chart? A Cause-Effect Project Chart is a graphical representation of the possible causes of a problem or outcome. It is often used in project management to identify the root cause of a problem, which can help project teams to develop effective solutions.
Pros of a Cause-Effect Project Chart:
- Provides a clear understanding of the problem: A Cause-Effect Project Chart provides a clear and detailed understanding of the possible causes of a problem, which can help project teams to identify the root cause and to develop effective solutions.
- Facilitates brainstorming: A Cause-Effect Project Chart can be used as a tool for brainstorming, which allows project teams to generate a wide range of ideas and to explore different possible solutions.
- Encourages collaboration: A Cause-Effect Project Chart can be easily shared with all team members and stakeholders, which encourages collaboration and transparency throughout the problem-solving process.
Cons of a Cause-Effect Project Chart:
- Can be time-consuming: Creating a Cause-Effect Project Chart can be a time-consuming process, especially for complex problems or outcomes. This may be challenging for project teams who are working under tight deadlines.
- May not account for all possible causes: A Cause-Effect Project Chart may not account for all possible causes of a problem or outcome, which can make it difficult for project teams to identify the root cause and to develop effective solutions.
- Can be subjective: The identification of causes and their relationships on the chart can be subjective and may vary depending on the interpretation of the team members involved in creating the chart.