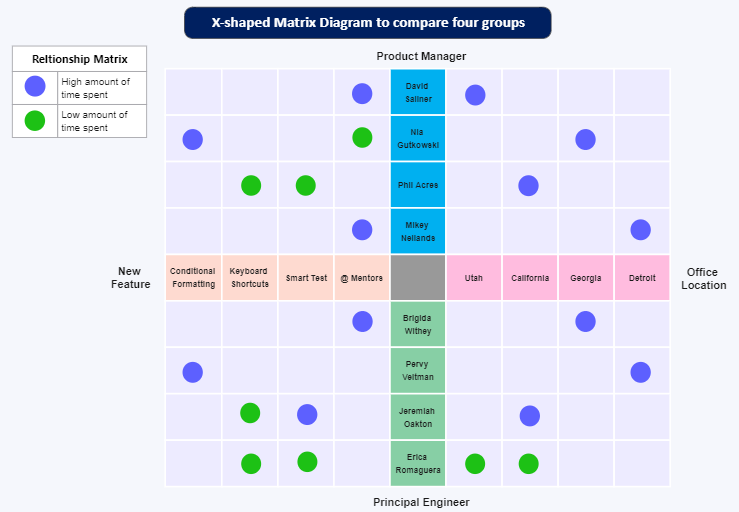
What is Matrix Diagram
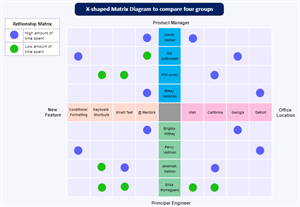
A Matrix Diagram is a quality management tool that is used to analyze and show the relationship between two or more sets of data. It is used to identify the strength of the relationship between different factors, and to evaluate their impact on a particular process or system. Matrix diagrams are often used in Six Sigma and other quality improvement initiatives.
The pros of using a Matrix Diagram include:
-
It provides a clear and concise representation of the relationships between different factors, which can help to identify areas for improvement.
-
It can be used to identify the key factors that are contributing to a particular problem, and to prioritize areas for improvement.
-
It allows for the comparison of different factors against each other, which can help to identify areas where improvements can be made.
-
It is a flexible tool that can be used in a variety of settings, including manufacturing, service industries, and healthcare.
The cons of using a Matrix Diagram include:
-
It can be time-consuming and complex to create, especially for large datasets.
-
It may require a significant amount of data to be collected and analyzed, which can be challenging for some organizations.
-
It may be difficult to interpret the results of the Matrix Diagram without a thorough understanding of statistical methods and analysis.
-
It may not be effective in identifying causal relationships between different factors, and may only show correlations between them.