What is Arrow Diagramming Method (ADM)
DEFINITION
Arrow Diagramming Method (ADM) is a project management technique used to create a visual representation of a project's tasks and their dependencies. It is also known as the Activity-On-Arrow (AOA) diagram, activity network diagram, network diagram, activity chart, node diagram, and CPM (critical path method) chart.
Arrow Diagramming Method is useful for identifying the critical path of a project, which is the sequence of tasks that must be completed on time for the project to be completed on schedule.
WHEN TO USE AN ARROW DIAGRAM
- When scheduling and monitoring tasks within a complex project or process with interrelated tasks and resources.
- When you know the steps of the project or process, their sequence, and how long each step takes.
- When the project schedule is critical, with serious consequences for completing the project late or significant advantage to completing the project early.
ARROW DIAGRAM PROCEDURE
1. Define the project scope: Before creating an ADM, it's essential to define the scope of the project. This includes identifying the project objectives, deliverables, and timeline.
2. Identify project tasks: Break down the project into smaller tasks. Each task should be specific, measurable, and achievable within a reasonable timeframe.
3. Determine task dependencies: Determine the relationships between tasks and their dependencies. This includes identifying which tasks must be completed before others can begin.
4. Determine task durations: Estimate the duration of each task. This can be based on historical data or expert judgment.
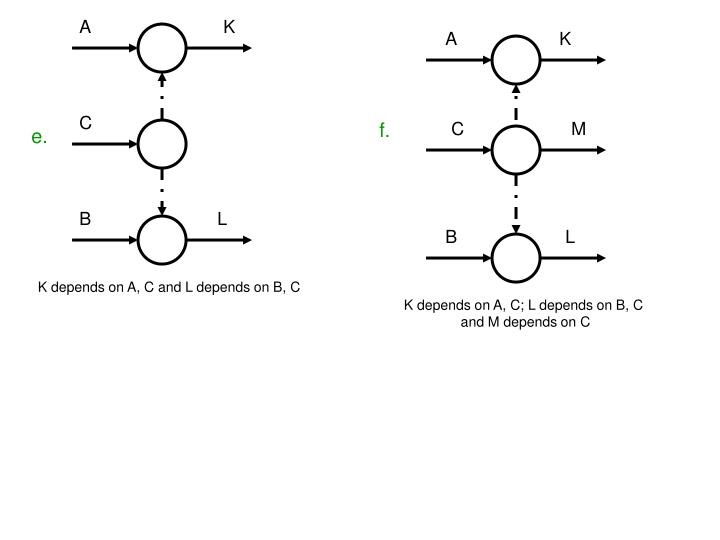
5. Create the ADM: Using a software tool or paper and pen, create a diagram that shows the project tasks as nodes and their dependencies as arrows. The nodes should be labeled with the task name, and the arrows should indicate the type of dependency and any lag time between tasks.
6. Identify the critical path: Identify the sequence of tasks that must be completed on time for the project to be completed on schedule. This is known as the critical path.
7. Update and monitor the ADM: As the project progresses, update the ADM to reflect any changes to the project timeline or task dependencies. Monitor the ADM regularly to ensure that the project is on track.
 |
By following these steps, project managers can create an effective project schedule that helps them complete the project on time and within budget.
ADVANTAGES
1. Visual representation: ADM provides a visual representation of the project tasks and their dependencies, making it easier for project managers to understand the project's structure and identify potential issues.
2. Critical path identification: ADM helps project managers to identify the critical path of the project, which is the sequence of tasks that must be completed on time in order for the project to be completed on schedule. This enables project managers to focus their resources on the most important tasks and ensure that they are completed on time.
3. Delay identification: ADM can help project managers to identify potential delays in the project schedule. By identifying these issues early on, project managers can take steps to mitigate them and keep the project on track.
4. Time management: ADM allows project managers to estimate the duration of each task and the overall project duration. This enables project managers to manage their time effectively and ensure that the project is completed on schedule.
5. Coordination: ADM helps project managers to coordinate the activities of different teams or departments involved in the project. By identifying the dependencies between tasks, project managers can ensure that each team or department completes their tasks in the correct order and on time.
6. Resource optimization: ADM allows project managers to optimize the allocation of resources, such as personnel or equipment. By identifying the tasks that require the most resources, project managers can allocate resources more effectively and ensure that the project is completed on budget.
DISADVANTAGES
1. Complexity: ADM diagrams can become very complex and difficult to read if the project has many tasks or dependencies. This can make it difficult for project managers to identify the critical path and potential delays.
2. Time-consuming: Creating an ADM diagram can be a time-consuming process, especially if the project has many tasks or dependencies. This can make it difficult for project managers to keep the diagram up to date as the project progresses.
3. Limited flexibility: ADM assumes that tasks can only start when their predecessors are completed, which may not always be the case in real-world projects. This can limit the flexibility of the project schedule and make it difficult to account for changes in the project plan.
4. Difficulty identifying multiple critical paths: In some projects, there may be multiple critical paths, each with different dependencies and durations. Identifying and managing these paths can be challenging with ADM.
In conclusion, while Arrow Diagramming Method has many advantages, project managers should also be aware of its disadvantages.
By considering these limitations, project managers can determine whether ADM is the right technique for their project and use it effectively to manage their projects.