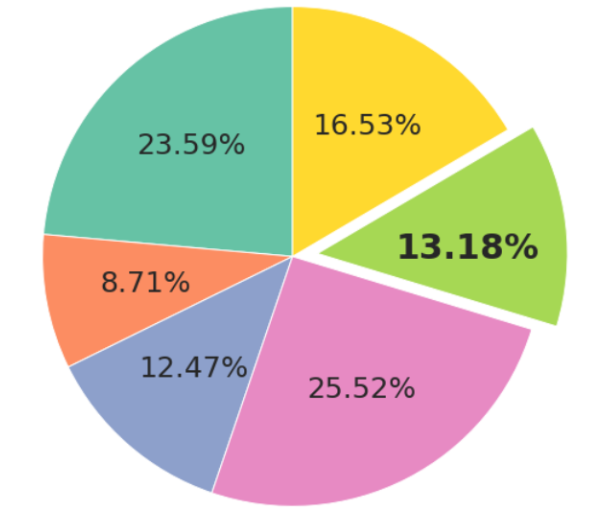
What is Pie Chart

A pie chart is a circular graph used to represent data, where the size of each wedge is proportional to the quantity it represents. The chart is divided into slices, each representing a portion of the whole. Pie charts are commonly used to show percentages or proportions of a whole, and are useful for quickly comparing the relative sizes of different parts of a dataset.

Pie charts are easy to understand and visually appealing, making them a popular choice for presenting data in a variety of contexts, such as business, education, and journalism. However, they are not always the most effective way to present data, as they can be difficult to read accurately, especially if there are many slices or if the differences between the slices are small. In such cases, other types of charts, such as bar graphs or stacked bar graphs, may be more appropriate.
Pros:
-
Easy to understand: Pie charts are simple and easy to understand, even for people who are not familiar with data analysis.
-
Visually appealing: Pie charts are visually appealing and can be used to make data more interesting and engaging.
-
Effective for showing proportions: Pie charts are particularly effective at showing proportions and percentages of a whole, making them useful for comparing parts of a dataset.
-
Quick to create: Pie charts can be created quickly and easily, making them a popular choice for presentations and reports.
Cons:
-
Limited use: Pie charts are not suitable for all types of data. They are best used when the data is easily divided into categories and the categories do not overlap.
-
Difficult to compare values: It can be difficult to compare the values of different slices in a pie chart, especially if there are many slices or if the differences between the slices are small.
-
Hard to read: Pie charts can be hard to read accurately, particularly if there are many slices or if the labels are small.
-
Misleading: Pie charts can be misleading if the slices are not accurately sized or if the data is presented in a way that distorts the proportions.
Overall, pie charts are a useful tool for presenting data, particularly when it comes to showing proportions or percentages. However, they do have limitations and should be used with care to avoid misrepresenting data or making it harder to understand.