Evaluate and deliver project benefits and value
Enablers
- Build shared understanding of project and value.
- Investigate that benefits are identified. (ECO 3.2.1)
- Document agreement on ownership for ongoing benefit realization. (ECO 3.2.2)
- Verify measurement system is in place to track benefits. (ECO 3.2.3)
- Evaluate delivery options to achieve benefits. (ECO 3.2.4)
- Inform stakeholders of value being delivered. (ECO 3.2.5)
- Evaluate impact to the organization and determine required actions. (ECO 3.4.3)
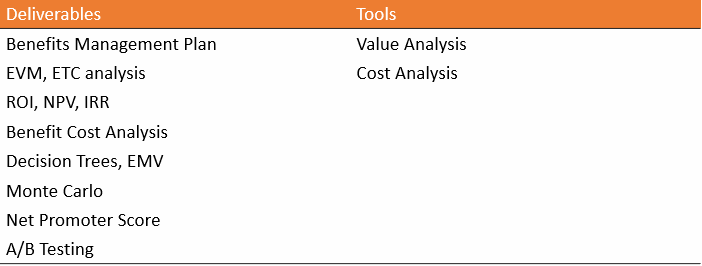
Deliverables, and Tools

Business Value
Business value is an informal term that goes beyond economic value.
Components of business value include:
- Shareholder value—in a publicly traded company, the part of capitalization that is equity as opposed to debt; for example, the number of outstanding shares multiplied by the current share price.
- Customer value—the value received by the customer of a product or service.
- Employee knowledge—an asset of the business, a frequently overlooked component of business value.
- Channel partner value—the value of a business’s partners.
Value Analysis
- Value analysis is the process of examining each of the components of business value and understanding the cost of each one.
- The goal is to cost-effectively improve the components to increase the overall business value.
- Value analysis = Product analysis : a T&T of Define Scope process
Benefits Management Plan
A benefits management plan is a document that describes how and when the benefits of a project will be derived and measured.
It typically includes the following components:
- Target benefits—the expected tangible and intangible business value to be realized from the project.
- Strategic alignment—how the benefits align with the business strategies of the organization.
- Timeframe—when the benefits (short-term and long-term) will be realized, usually by project phase.
- Benefits owner—the person or group that monitors, records, and reports the benefits.
- Metrics—the direct and indirect measurements of the realized benefits.
- Risks—the risks associated with achieving the targeted benefits.
Sprint Reviews/Demos
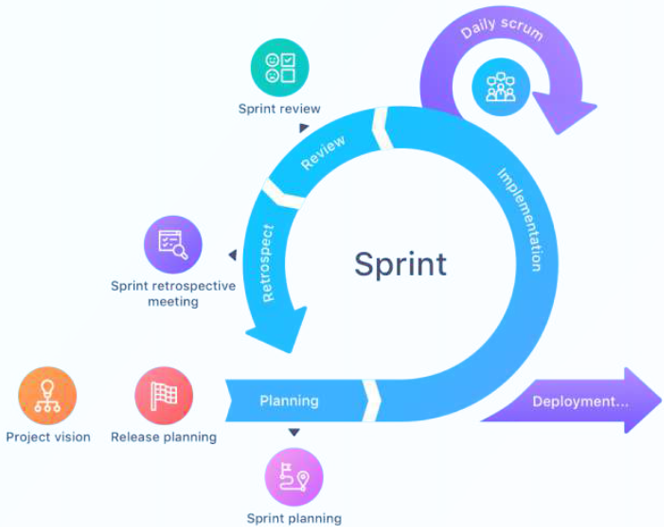
- In an agile project, at the end of each iteration or sprint, the team will host other stakeholders and conduct a sprint review or demo.
- Part of the purpose of agile approaches is that the team is focused on completing whole user stories in each sprint; in other words, everything is done, and the
- capability is "potentially shippable.“
- In the early stages, obtaining the product owner’s acceptance of the story and any feedback enables the team to make the necessary changes to optimize business value.

Release Management
Agile projects have the ability to convert high-value capabilities into delivered solutions early.
The Product Owner defines the initial capabilities that make up the Minimum Business Increment (MBI).
In traditional projects, release occurs at the end when everything is done, but you are never completely done.
The MBI offers enough of the high-value aspects of a solution to start using it and benefit from it.
Define an approach for subsequent releases driven by the following:
- Availability of a certain set of features or capabilities.
- Organizational tolerance for changes.
- A time cadence specifying that subsequent releases are planned on a consistent schedule, such as one per month.
Benefit Cost Analysis
Benefit cost analysis is a systematic approach to estimating the strengths and weaknesses of alternatives used to determine options which provide the best approach to achieving benefits while preserving savings.
- Also called cost-benefit analysis
- Frequently used to compare potential projects to determine which one to authorize.
- Goal is to select the alternative whose benefits outweigh costs by the largest amount.
- Alternative should not be chosen when costs exceed benefits.
- The value of a benefit cost analysis depends on the accuracy of the estimates of cost and benefit.
Return on Investment (ROI)
Return on Investment (ROI) is a financial metric of profitability that measures the gain or loss from an investment relative to the amount of money invested.
- Sometimes called the rate of return
- Usually expressed as a percentage
- A positive ROI is interpreted as a good investment, and a negative ROI is a bad investment
Present Value (PV)
The present value (PV) is the current value of a future sum of money or stream of cash flows given a specific rate of return.
The PV formula is:

For example, if you need $3,000 in three years and can invest your money at 8 percent interest, the present value (your initial investment) is calculated as shown.

Net Present Value (NPV)
The net present value (NPV) is a financial tool that is used in capital budgeting. It is the present value of all cash outflows minus the present value of all cash inflows.
- NPV is a financial tool that is used in capital budgeting.
- NPV compares the value of a dollar today to the value of the same dollar in the future after taking inflation and discount rate into account.
Internal Rate of Return (IRR)
The Internal Rate of Return (IRR) is also a financial tool often used in capital budgeting. It is the interest rate that makes the net present value of all cash flow equal to zero.
- IRR is also a financial tool often used in capital budgeting.
- Higher is better.
Net Promoter Score (NPS)
The Net Promoter Score (NPS) measures a customer's willingness to recommend a provider’s products or services to another on a scale of -100 to 100.
NPS = % of Promoters - % of Detractors
Higher scores indicate customer delight and willingness to recommend the solution.
Assign a number 0 to 10 for customer’s self-reported satisfaction.
Customer categories are as follows:
- Detractors (0-6): Would be very willing to work with another provider, as some aspect of the solution left them less than satisfied.
- Passives (7-8): Somewhat satisfied, but may be willing to try competitive offerings.
- Promoters (9-10): Very satisfied, and would choose to work with the provider again. May choose to evangelize the solution to other people.
AB Testing
- When different approaches are available, project teams might ask users for their preferences.
- Used in marketing, AB testing is a method for determining user preferences.
- Different sets of users are shown similar services with one difference known as the independent variable.
- Based on the results of the AB testing experiment, you can optimize the solution you provide to users.
Simulation
Simulation * is a technique that uses computer models and estimates of risk to translate uncertainties at a detailed level into their potential impact on project objectives.
- Uses computer models and estimates of risk.
- Translates uncertainties into potential impact.
- Involves calculating multiple project durations using varying sets of assumptions.
Example: The project team for the multimedia campaign decides which printing contractor to use and chooses between two vendors.
Decision Tree Analysis
Decision tree analysis * is a diagramming and calculation technique for evaluating the implications of a chain of multiple options in the presence of uncertainty.
Decision trees allow decision makers to evaluate both the probability and impact for each branch of every decision under consideration, making it a useful tool for risk analysis.
Solving the decision tree indicates the decision that will provide the greatest expected value when all the uncertain implications, costs, rewards, and subsequent decisions are quantified.
Expected Monetary Value
Expected Monetary Value (EMV) is a method of calculating the average outcome when the future is uncertain.
Opportunities will have positive values and threats will have negative values.
EMV is found by multiplying the monetary value of a possible outcome by the probability it will occur.

Expected Monetary Value
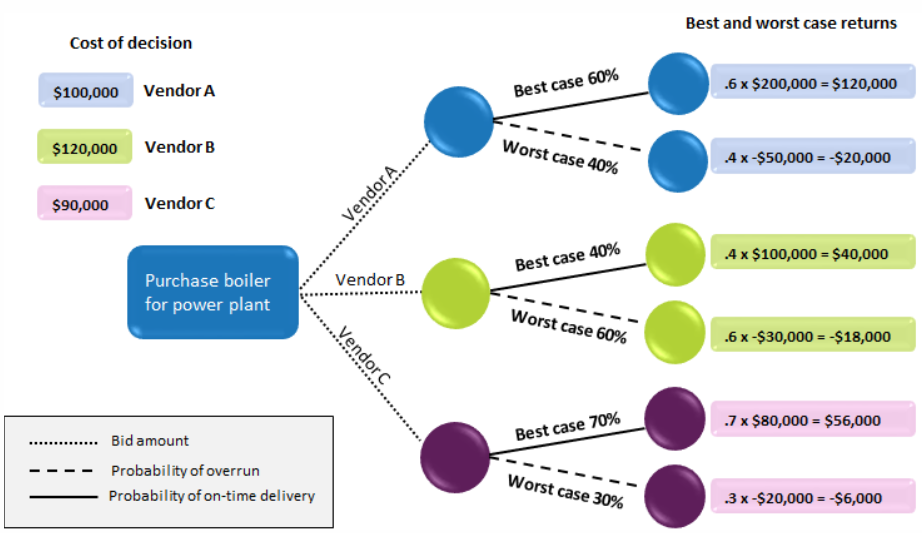
Example: Selecting a Vendor Using Decision Tree Analysis
- As shown in the preceding figure, three vendors have provided bids on a new boiler. These bids are referred to as the cost of making a decision. Based on historical data from other projects, Vendor A has a 60% probability of on-time delivery and an impact of $200,000. The resulting risk is $120,000 (with the probability of 60% times an impact of $200,000). If Vendor A is late, an impact of - $50,000 will occur and the risk will be -$20,000. The expected monetary value is the sum of both risks, which is $100,000. Similar EMV calculations can be made for the other vendors ($22,000 for Vendor B and $50,000 for Vendor C).
- Vendor A would be the preferred choice, because it has the highest risk in terms of EMV. A secondary choice would be Vendor C.