Plan and manage quality of products and deliverables
Enablers
- Plan quality standard required for project deliverables. (ECO 2.7.1 )
- Recommend options for improvement based on quality gaps. (ECO 2.7.2)
- Continually survey project deliverable quality. (ECO 2.7.3)
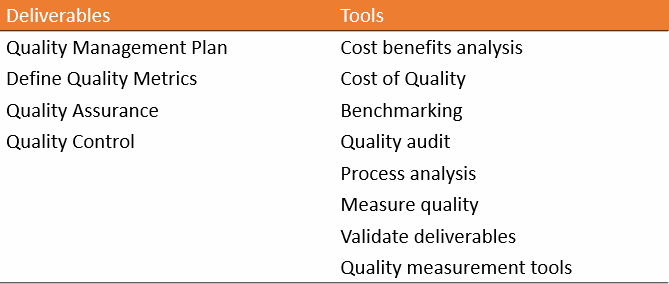
Deliverables, and Tools
Quality
Quality * is the degree to which a set of inherent characteristics fulfills requirements.
Quality Standards and Regulations
- A standard * is a document established by an authority, custom, or general consent as a model or example.
- Regulations * are requirements imposed by a governmental body. These requirements can establish product, process, or service characteristics, including applicable administrative provisions that have government-mandated compliance.
- De facto regulations: Regulations that are widely accepted and adopted through use.
- De jure regulations: Regulations that are mandated by law or have been approved by a recognized body of experts.
- ISO 9000 Series: A quality system standard that can be applied to any product, service, or process in the world.
Validated Deliverables
- Products and other outputs are measured against the quality standards set by the project.
- When the quality standards are neither met nor within acceptable ranges, corrections and controls are put into action.
- Project team performs the validation and deliverables are verified by the customer, which equates to validated deliverables.
- All project deliverables must be validated based on quality standards or acceptance criteria.
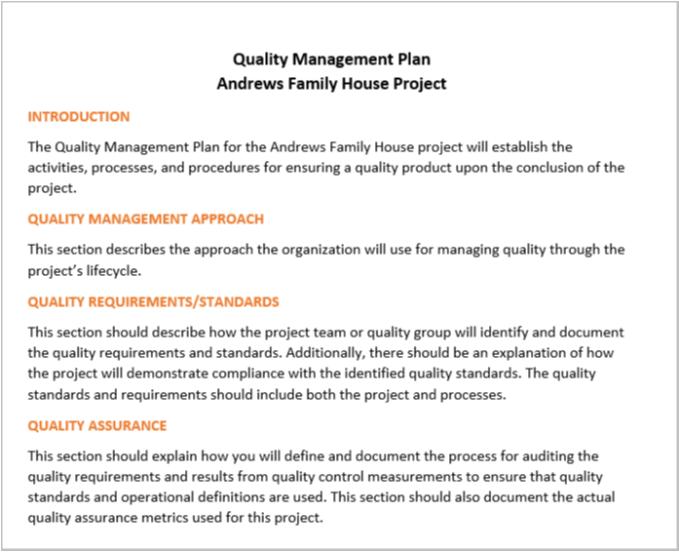
Quality Management Plan
A quality management plan * is a component of the project or program management plan that describes how applicable policies, procedures, and guidelines will be implemented to achieve the quality objectives.
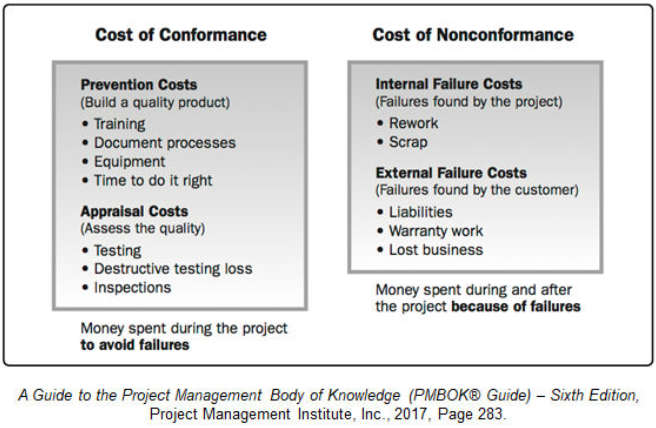
Cost of Quality
Cost of Quality (CoQ) * refers to all costs incurred over the life of the product by investment in preventing non-conformance to requirements, appraisal of the product or service for conformance to requirements, and failure to meet requirements.
Quality Metrics
- Quality metric * is a description of a project or product attribute and how to measure it.
- Tolerance is the allowable variation in this measurement.
Quality Audits
A quality audit * is a structured, independent process to determine if project activities comply with organizational and project policies, processes, and procedures.
- Improves quality performance of a project.
- Can be conducted at scheduled or random intervals.
- Topic include:
- Quality management policy
- Collection and use of information
- Analytical methods
- Cost of quality
- Quality process design
Guidelines to Manage Quality
- Ensure that random and/or scheduled quality audits are conducted by qualified auditors
- Use one or more of the Manage Quality tools and techniques to determine the causes of quality problems of the project's product, service, systems, or processes
- Identify and implement the appropriate actions to increase the effectiveness and efficiency of the project team's work results to improve quality in the product or service
Quality Measurement Tools
There are a variety of tools available for continually surveying the quality of your project. The following tools are discussed.
- Control Charts and Variability
- Pareto Chart
- Statistical Sampling
- Statistical Sampling Process
Control Charts and Variability
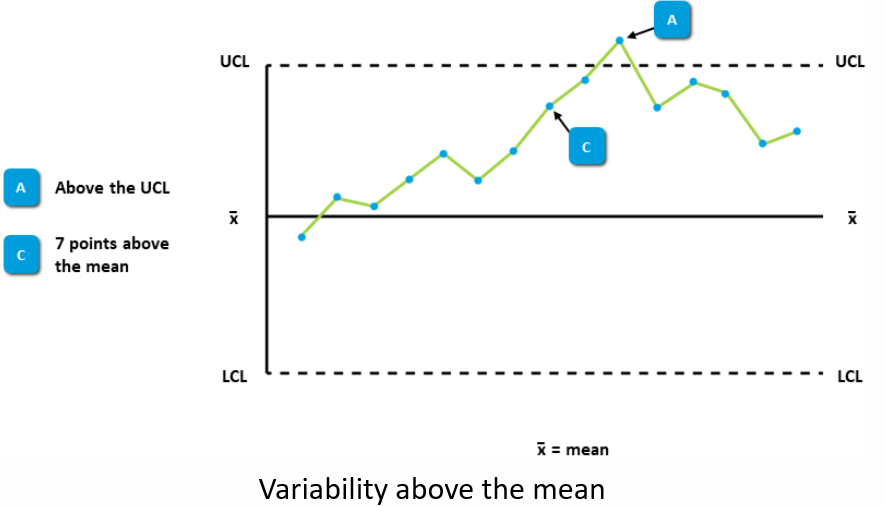
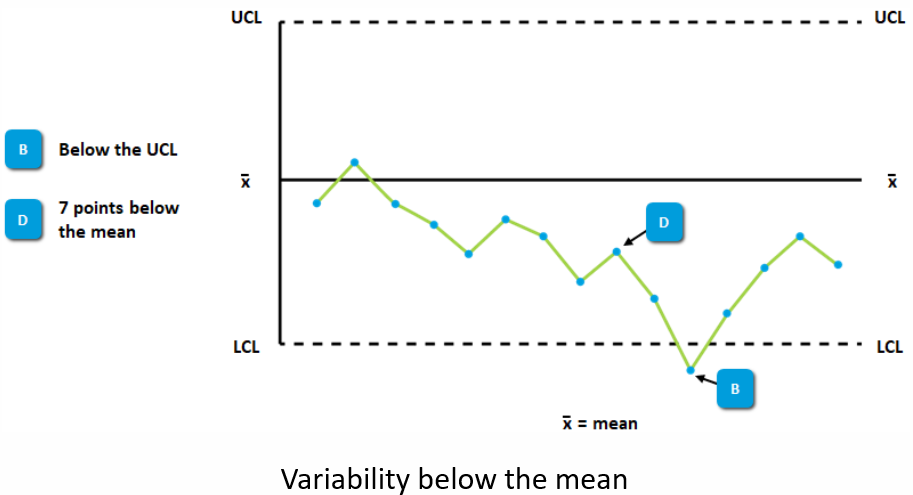
Variability Indications
- Measurements that exceed the range between the upper and lower control limits are considered to be an indication of instability.
- The variability expressed is atypical for the process and may be an indication of a special source of variance.
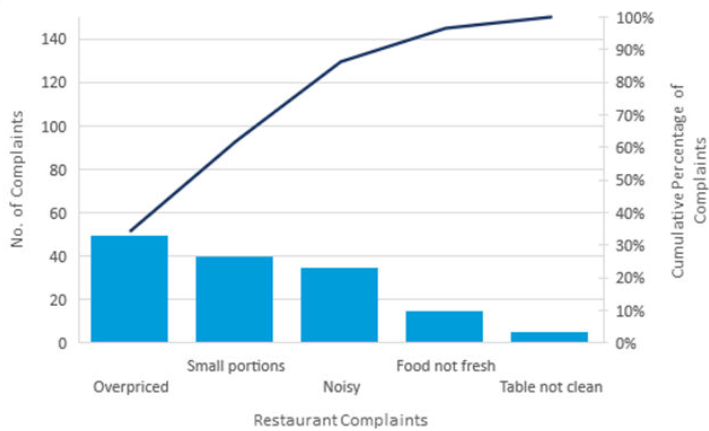
Pareto Chart
Statistical Sampling
Statistical sampling * is defined as choosing part of a population of interest for inspection.
- Used to determine characteristics of an entire population based on actual measurement of its representative sample.
- Produces a process that does not require inspection of every item.
Statistical Sampling Process
- The statistical sampling process involves dividing sampling data into two categories—attribute and variable—each of which is gathered according to sampling plans.
- Helps reduce overall quality costs when used during quality control.
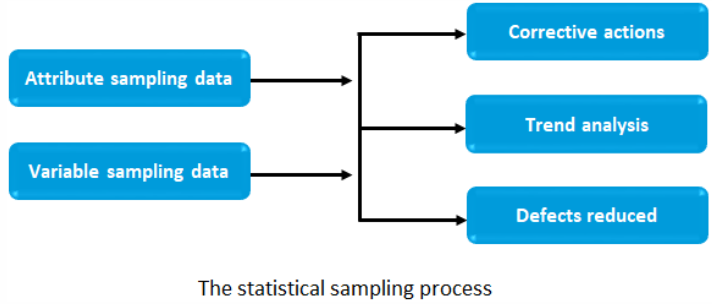
Attribute Sampling Data
Attribute sampling data is data from the sample that is counted such as the number of employees participating in profit sharing, the number of customer complaint calls, and the number of returned items.
Variable sampling data is data from a sample that is measured on a continuous scale such as:
- Time
- Temperature
- Weight
Guidelines to Controlling Project Quality
- Conduct inspections to detect quality errors as project work is ongoing.
- Use Pareto diagrams to focus corrective actions on the problems having the greatest effect on overall quality performance.
- Use control charts to analyze and communicate the variability of a process or project activity over time.
- Identify ways to eliminate causes of unsatisfactory results.
- Use flowcharts to identify redundancies, missed steps, or the source of quality performance problems.
- Initiate process adjustments by implementing corrective or preventive actions necessary to bring the quality of work results to an acceptable level.
- Continue to monitor, measure, and adjust quality throughout the project life cycle.